DevOps is a mature philosophy that promises faster time to market and higher product quality. But how can you realize these benefits? You need to understand what metrics separate high-performing teams from average DevOps practitioners. This article will explain the essential DevOps metrics and how to measure them.
As a software development company, MindK has been implementing DevOps practices for the past 6 years. Tracking the progress of our teams allowed us to have more visibility and control over the delivery process. We would like to share some insights gained while working on our projects, combined with prominent research and best practices from the world’s top DevOps companies.
Table of contents
- What are the four essential DevOps metrics?
- deployment frequency
- Lead time for changes
- Change failure rate
- Mean time to recovery (MTTR)
- Additionally, DevOps metrics and KPIs
What are the key four DevOps metrics?
Google’s DevOps Research and Assessment (DORA) is the largest academic study exploring the DevOps principles and their practical application. Over 7 years, the DORA researchers tried to find the factors that differentiate high-performing DevOps teams. In the end, they narrowed the list to just four DevOps success metrics:
- Deployment frequency
- Lead time for changes:
- Mean time to recovery (MTTR); and
- Change failure rate.
The first two can help you measure delivery speed. The latter reflects overall stability. Combined, these are four key metrics for DevOps that give you an objective way to assess your performance and track progress over time. So let’s review them in detail.
Deployment frequency
How often do you deploy code? There are different ways to answer this seemingly simple question. You can deploy code to staging or production environments without releasing it to end-users. At MindK, we believe that such deployments shouldn’t count towards your deployment frequency. Pre-production changes deployed to a staging environment are instead called “delivery” (which is also important for high performance).
Tracking deployment frequency on a daily or weekly basis allows you to identify changes that provide the most benefits and areas that require additional work. An abrupt drop in deployment frequency might indicate that a workflow is being impacted by other projects or staffing problems.
What is a good deployment frequency? Top-performing teams can deploy code whenever they want, multiple times a day. This requires you to have CI/CD pipelines with automated testing and feedback mechanisms. Less mature teams often have to deal with weekly or monthly deployments. These bigger deployments increase the risks of failure, leading to downtime and lower satisfaction.
Data source: 2021 State of DevOps report
Lead time for changes
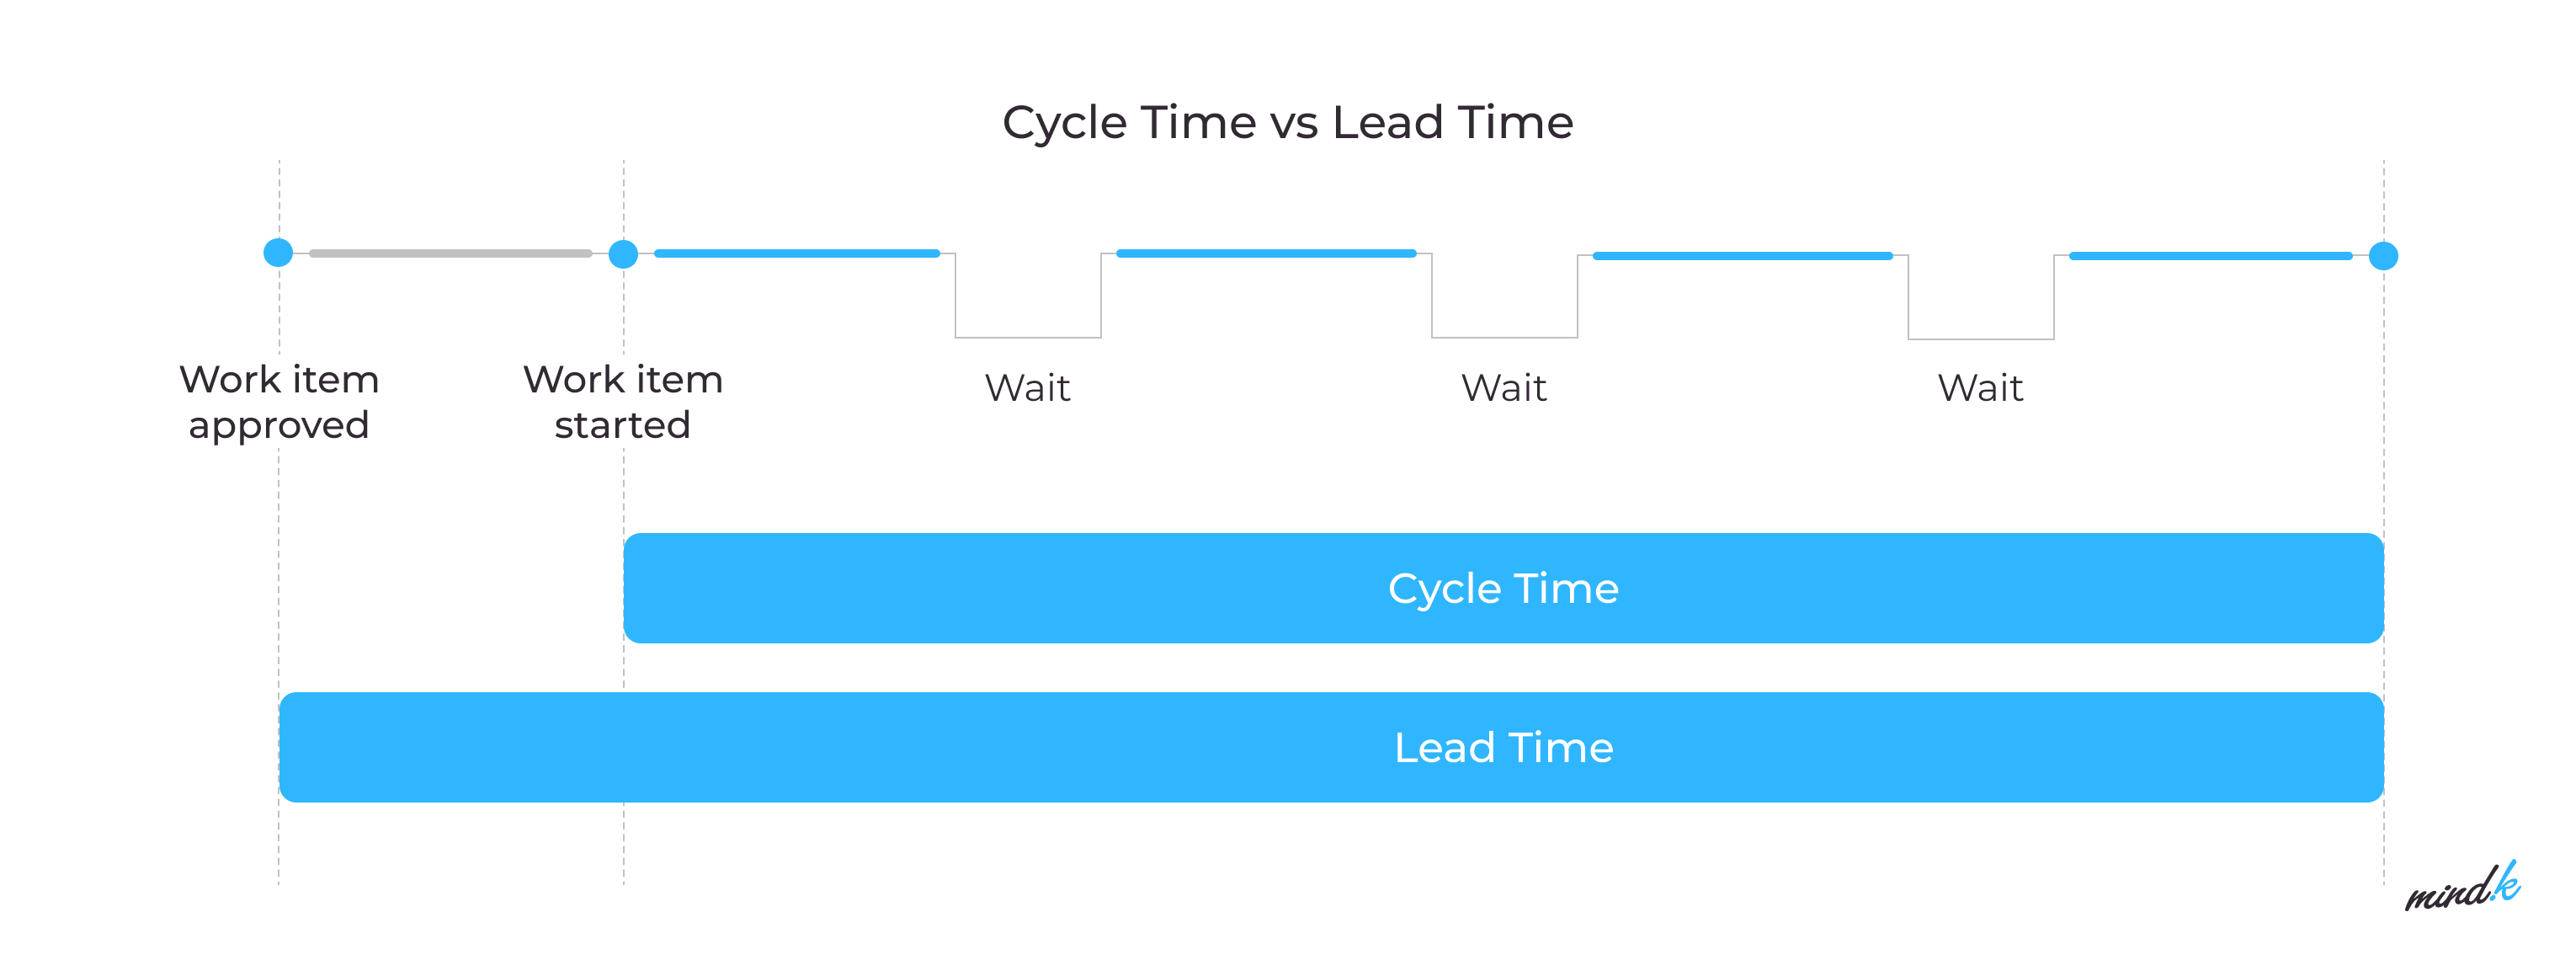
How much time does it take you to go from an idea to production-ready code? To calculate the lead time, you need to correctly identify the start of work and its finish. For example, from the time of commit to the start of a release,
What is a good lead time for changes? Mature DevOps teams are fast at introducing changes, with lead times estimated in hours rather than days or weeks. You can decrease the lead time by using practices such as:
- Automated testing;
- Working in small increments, and
- Trunk-based development: small code updates with the main branch of your repository as often as possible (trunk-based development).
On the other hand, committing large changes to different branches and using manual-only testing causes longer lead times.
Data source: 2021 State of DevOps report
Change failure rate
How many of your changes led to failure compared to successful deployments? Both hotfixes, failed deployments, and rollbacks will contribute towards this metric (unlike issues discovered in QA and fixed before production).
Tracking change failure is essential for the early detection of defects, their fixes, and guaranteeing the new deployments satisfy your security requirements. If deployments fail too frequently, this will lead to downtime, which affects both user satisfaction and the company’s bottom line. In this case, you might want to scale back and inspect your delivery pipeline for any issues.
What is a good change failure rate? For mature DevOps teams, the percentage of deployments that need fixes ranges from 0 to 15%. You can decrease the change failure rate with the help of robust monitoring and progressive delivery practices like working in small increments, trunk-based development, and a robust test automation strategy.
Data source: 2021 State of DevOps report
Mean time to recovery (MTTR)
How long does it take to get back on your feet after an unexpected outage? MTTR reflects your ability to respond to serious issues. As modern systems become more complex, more failures occur. It is no longer viable to wait until the deployment is perfect to avoid incidents. That’s why developers have to embrace the philosophy of gradual improvement. Measuring MTTR can help you analyze your deployment process and find efficient solutions.
What is a good mean time to recover? Mature DevOps teams are fast to recover from failure. Their MTTR is typically under 1 hour. Less agile teams can have an MTTR of under a week.
To improve this metric, you need to quickly detect a system failure and release a fix or rollback the changes that introduced the failure. Continuous monitoring is essential for this purpose. Prometheus, Grafana, and Loki are some of the DevOps tools we use to monitor MTTR. With proper configuration, these tools allow you to get alerts about potential problems when the application deviates from the standard metrics. Then you can add resources, storage, or roll out fixes before the failure. That’s why your maintenance engineers should also have the necessary permissions, instruments, and processes to resolve these issues.
Data source: 2021 State of DevOps report
The 4 DORA metrics represent the main DevOps KPIs you should track on your projects. Conscious efforts to improve them will have a tangible impact on business value. Higher deployment frequency can help eliminate wasteful processes. Faster MTTR may improve user satisfaction. And lower failure rates allow faster delivery, which is always nice.
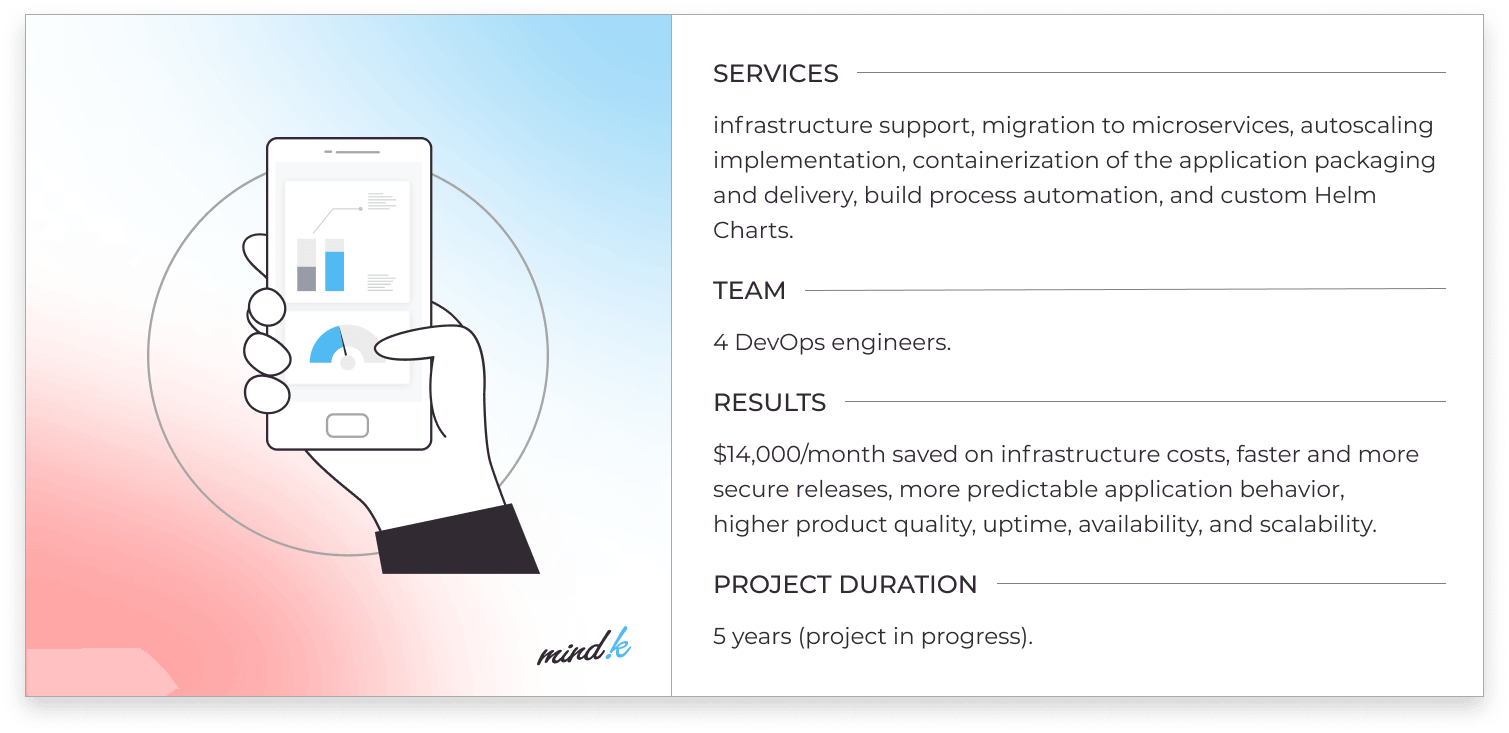
One of our projects is a good case to show why these metrics matter. Five years ago, we were contacted by a large US company that helps businesses track their online reputation. They had a huge legacy project that was a pain to improve and maintain.
Most of the processes require manual intervention. To build an application, engineers would launch Ansible on a local machine. Releases were unstable and unpredictable, making on-demand delivery a pipe dream. Lead time for changes was counted in weeks. The change failure rate was as high as 25%. The project needed some serious reworking.
MTTR are measuredtheirOur DevOps team started by introducing an automated CI/CD pipeline in Github Actions. Right away, this reduced deployment frequency and made releases more predictable. We then migrated the project to microservices, infrastructure as code, and Docker/Kubernetes. As a result, the failure rate dropped below 5%. Lead time and MTTR now measure in hours, and on-demand deployments are now technically possible. If you want to learn more about the work done by our DevOps teams and its results, you can check out the full case study.
Additionally, DevOps metrics
There are other, more situational indicators you can measure depending on your specific challenges and goals. Below we list some of them.
Defect escape rates
Bugs are inevitable, even with a well-tuned delivery pipeline. Some of them will be caught by your developers and QA staff. Some will leak into production. The defect escape rate describes the number of defects caught during or after the deployment. A high defect escape rate indicates issues in your development and QA process.
Automated tests pass (%)
This is another quality indicator. As your team strives for faster delivery, it will have to utilize automated unit and integration testing. That’s why measuring the automation suite is indicative of your DevOps performance. It’s always useful to know when changes to the code result in breaking your tests.
Deployment time
How much time does it take to deploy code to production? High-performing teams strive to deploy often, which is easier if the process itself is quick. This might be a pretty uncommon metric, but measuring deployment time can help you detect potential issues in your pipeline.
Cycle time
This is a subset of lead time. It represents the time from starting work on a piece of code until it is released to end-users. Aiming to reduce cycle times often leads to less work in progress and higher efficiency in workflows.
Availability
Modern solutions require high uptime so that users from all over the world can enjoy your services. Depending on the type of system and the way you deploy it, there can be some downtime during scheduled maintenance. So it’s a good idea to measure maintenance time and unintended outages.
Error rates
Errors can affect your application’s quality, performance, and availability. Good exception handling is essential for quickly discovering bugs in your code, issues with query timeouts, database connections, and so on. You should also track those errors over time and look for unexpected spikes.
Failed deployments (mean time to failure)
How often do deployments lead to outages or impact the user experience? Rolling back a bad deployment should always be the last option. Yet, measuring this metric over time can be a good idea if you experience such issues.
Application usage and traffic
Once released, you’d like to track the number of transactions users normally make. Sudden spikes or drops in usage might signal potential issues.
Application performance
You’d want to find performance issues and concealed errors prior to a release. Yet, continue monitoring your system’s performance for sudden changes even after deployment. Often, you’ll see big changes in the usage of certain database queries, calls to some web services, and so on.
Mean time to detection
How fast are you at detecting issues in production? The worst thing that could happen is a major service outage that you’ve got no idea about. That’s why you’ll need healthy application monitoring and great coverage to quickly identify issues and fix them before they cause major problems.
Conclusion
The truth is simple – you can’t improve something you don’t measure. Deployment frequency, lead time for changes, MTTR, and change failure rate are the most important metrics measured by DevOps. Together, they provide the foundation to identify any waste in your DevOps processes and improve the whole value stream of the product.
Working in small increments, automated testing, monitoring, continuous integration delivery, and deployment (CI/CD) are some of the best practices to improve these key DevOps metrics.
It’s a good idea to start with an honest assessment of your DevOps capabilities. Our DevOps outsourcing company has the necessary expertise to both analyze your pain points, create a tailored improvement plan, and help with its implementation. You can explore the full list of our services or request a free consultation by clicking on the picture below.


